
Hawthorn, Goodhart and Friedman Walk Into an Agile Team Room – What Happens Next Will Amaze You…
 Velocity is one of the most commonly used agile metrics. Teams (and their stakeholders) often focus on “improving velocity” without either a proper consideration for root causes that impact velocity or a holistic view.
Velocity is a lagging indicator – like your body weight or unemployment. You don’t fix unemployment by focusing on the rate of employment, you fix unemployment by fixing the economy. You don’t affect your body weight by just looking at the scale. You examine the root causes for increases or decreases.

Perverse Incentives…
At the end of an iteration, a scrum team has a velocity. A simple measure of a complex system. And increasing velocity doesn’t necessarily mean the team is healthier. Teams could achieve higher velocity with a bad outcome (technical debt, lots of escaped defects). While team velocity can be a good long term predictor, it can be negative in the short term if a team’s focus is simply on increasing velocity for velocity’s sake.
With “Velocity as the Goal,” three laws will influence the outcome:
 Hawthorn Effect – that which is measured will improve, at a cost…
- Goodhart’s Law – when a measure becomes a target it ceases to be a good measure.
- Friedman’s Thermostat – correlation is not causation.
As the good W. Edwards Deming said, “What matters is not setting quantitative goals but fixing the method by which those goals are attained.”
In other words, with velocity as the goal, instead of focusing on delivering working software that has business value for stakeholders, the team will be concerned with simply delivering more story points (e.g., to meet a target velocity). To do so the team will likely sacrifice quality with the side effect of brittle code, technical debt and bug fix cycles, and a slower velocity in the long term.
In his book Managing for Happiness, Jurgen Appelo provides 12 rules for good measurement:
- Measure for a Purpose
- Shrink the unknown
- Seek to improve
- Delight all the stakeholders
- Distrust all numbers
- Set imprecise targets
- Own your metrics
- Don’t connect metrics to rewards
- Promote values and transparency
- Visualize and humanize
- Measure early and often
- Try something else
Let’s see how we can apply these to agile software development.
Agile Performance Metrics – Measure Many Things
There will never be a single view that will provide all the information teams need to stay on track or to identify potential for improvement (kaizen) [#5 & 12]. Sure, they can look at the Velocity Chart, but only when they overlay trends in multiple views (technical as well as human) can they get a holistic perspective of what is happening. [#2 & 11] And combined, still, those multiple views can only serve to raise a flag that says “Look deeper here… what’s going on?” [#9 & 10]
Furthermore, when considering any metrics, teams should not simply be striving for ever-increasing values. [#6 & 8] They should look at the variations. And then get to the root causes of that variability. By striving for consistency and stability (i.e., predictability) [#3 & 7] they will find that increased performance (velocity included) will come as a natural side effect. [#1 & 4]
Variability
So how do teams examine variability?
Let’s look at some example data sets, using sprint velocity – Set A: 10, 11, 9, 10 story points per sprint and Set B: 7, 14, 6, 10 (Note: these sets are for the same team over time, comparing velocities across teams makes no sense).
 In both cases, a “tomorrow’s weather” approach based on the rolling average of the team’s velocity would give an estimate of 10 – which they can then use to project out and get a “done date” based on the sized backlog of epics, features, and stories.
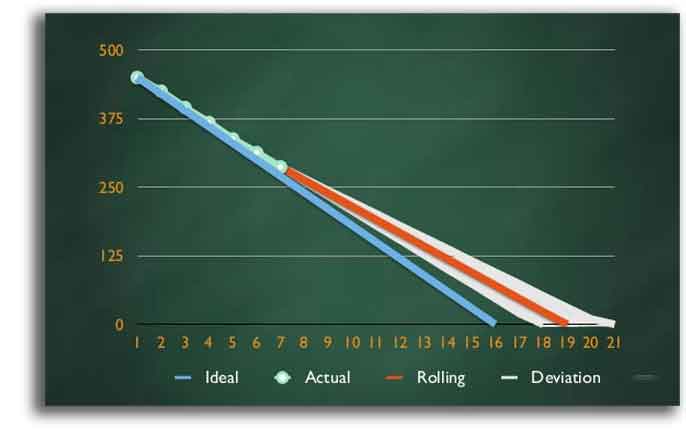
Simply relying upon the average would be misleading. The team needs to add a standard deviation, and then they obtain a range and a very different projection.
Consistency / Reliability
Teams should plot a summary of their historical sprint metrics, including averages, and deviations is there a huge range between the highs and lows. What might a highly variable sprint velocity indicate? Well, it depends! Teams should at least examine the following factors in their retros:
- Distractions
- Story composition
- Variable story size
- Dependency on other teams or external SME’s
- Complexity of features
- Underestimating effort
- Overestimating available time
- Changing team composition
Other Lenses to Look Through
5 Types of Scrum Metrics, nicely categorized by Jason Tice @theagilefactor:
- Process Health – Assess day-to-day delivery team activities & evaluate process changes
- Release – Direct focus to identify impediments to continuous delivery
- Product Development – Align product features to user needs
- Technical / Code – Determine the quality of implementation and architecture
- People / Team – Promote sustainable place and team engagement
In addition to velocity, overlaying one or more of these types of metrics over time will help teams to begin to zero in on possible root causes of variation, as well as the impact of changes introduced (with the best of intentions for continual improvement).
42+ Metrics for Agile Teams
 Disclaimers – No team should attempt to use all of these at the same time. Ever. Pick one or two and get started. Then add one or two more over time. 3, 5 or perhaps up to 10 max might be in use at any given time. Any more and you’ll likely get into analysis paralysis. It is up to the team to choose (i.e., which ones to try out are a type 2 or type 3 decision), which metrics they think will be useful. If you are a coach or manager, DO NOT mandate any specific metric, nor a minimum number of metrics. Finally, neither teams nor managers should compare metrics across teams. Use the metrics to start conversations, and to share knowledge and insights gained across teams, yes. But: “My velocity is higher than yours…” never…. even if teams have normalized their benchmark stories…
Process Health Metrics
Cumulative Flow Diagrams
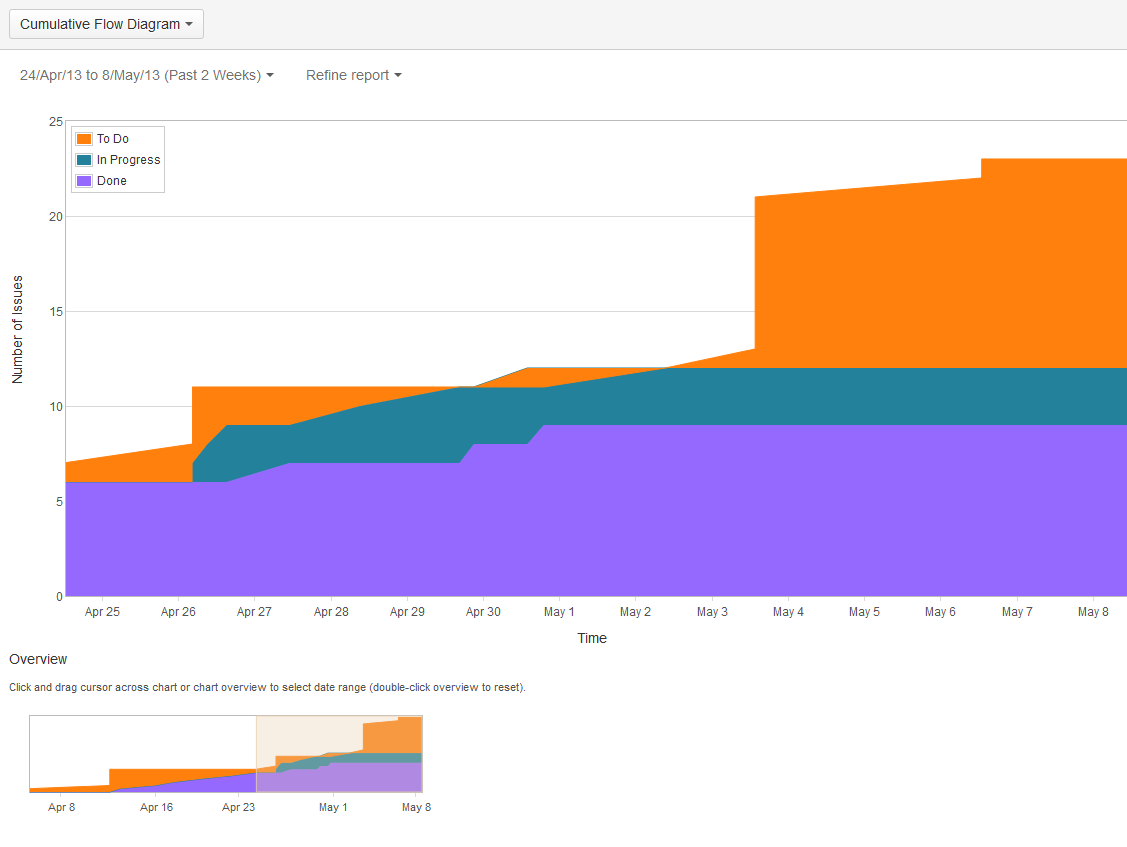 Look at lead times, work in progress (WIP) at the various stages toward Done.
Are there peaks, plateaus, valleys? What can they tell you? Use the CFG to identify the growth of the backlog over time, changes in scope. Where in the workflow do things spend the most time? Where can the greatest impact be made?
To learn more about JIRA’s CFD’s and refining the view on Atlassian’s support site.
More on CFD, from a Kanban perspective here.
Control Charts
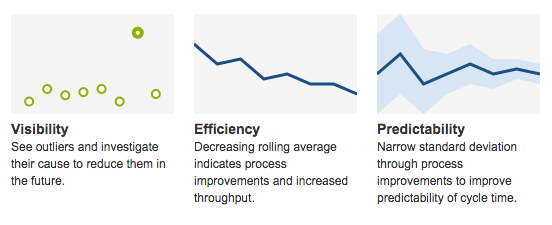
Look at lead and cycle time (amount of time needed to complete an item), average, rolling average, standard deviation.
Look at the scatter for positive correlations of things we can measure”:
- Does story complexity impact velocity?
- Does business value correlate to velocity?
- How about more code coverage?
- Code complexity?
Learn more about JIRA’s Control Chart and how to refine the views.
More on lead and cycle time on Eylean’s blog.
Percent Complete and Accurate
Measures the number of completed and acceptable work items. Helps the team improve delivery by measuring completion and quality.
-
- Is there a high percentage of committed work that is complete & accurate?
- If not, examine clear acceptance criteria and definition of done.
Flow Efficiency
Tracks the ratio of time spent working on an item vs. time the item waits. A team can use it to calibrate Work-In-Progress (WIP) limits to minimize delay and promote flow. The goal is a consistent wait/run ratio for each work item, which then increases efficiency
Time Blocked per Work Item
Measures the amount of time that an item was blocked during its completion, and is used to determine the cost of delay & propose proactive mitigations avoidances.
Goal: Reduction in time blocked per story through avoidance and faster mitigation
Blocker Clustering
Shows the frequency and grouping of items that block work items, which helps to identify the largest sources of delay and propose common mitigations. Possible outcome: Reduction in occurrence of types of blockers via proactive mitigations
Release Metrics
Escaped Defects
A count of defects that are discovered in production. Used to then identify root causes as to why defect not detected before release. Also creates clear agreement on an acceptable level of escaped defects with a shared understanding of mitigations identified to reduce future escaped defects.
Escaped Defect Resolution Time
Measures the amount of time required to resolve an escaped defect. Provides clarity into the unplanned cost of resolving escaped defects. Used to help the team achieve a balance between proactive testing and sustainable Service Level Agreements (SLAs).
Release Success Rate
This is the ratio of accepted vs. rejected releases from the customer. Encourages partnership between team & customer. The end goal is a high percentage of accepted releases due to effective process, consensus on done criteria & feedback loops.
Release Time
Shows the amount of time required to release the product to the production environment. Used to establish a consensus on sustainable cost/time for a production release, with the end goal of sufficient automation to reduce time/cost for the desired level of business agility.
Time Since the Last Release
The metric displays the amount of time since the team last released their product to end-users. Getting the product in the hands of users allows teams to integrate more user feedback into development activities and build the “right” product.
Cost Per Release
The cost to complete a software release (planned and/or unplanned) enables consideration of economic factors when deciding when/if to release. Encourages investments to reduce release cost via automation to an agreed-upon level.
Release Net Promoter Score
Ok, time to get squishy… Are teams “Designing and deploying a great customer experience quickly – again and again over time”? They could be moving fast, but are they moving fast in the right direction? Yes, you can measure that:
- External Net Promoter Score (NPS) a wonderful agile team metric)
Release Adoption / Install Rate
Measures the number of existing users that have upgraded as well as the number of new users gained from release. Used to assess ROI on product development and validate business /market assumptions. Does ROI meet or exceed business assumptions? Identify users that have not upgraded – determine why.
Product Development Metrics
Customer / Business Value Delivered
The amount of business value provided by each completed work item, epic, feature or release. Allow team and stakeholders to manage ROI, focusing on the highest value work items first; as well as considering moving on as value left in backlog decreases. Another powerful agile team metric.
Risk Burndown
Measures the amount of known and unmitigated risk shown across time. Encourages team self-management to reduce project risk. Goal: Product risk trending down to an acceptable level over time; balancing investment between building product and reducing risk.
Push / Pull
This is the ratio/count of work items completed vs. work items added. Used to guard kanban teams against being overwhelmed with work that can compromise focus and commitment. Goal: Push / Pull is balanced – new work is added to the backlog when work-in-progress is completed.
Product Forecast
Future trend lines (best-case, worst-case) based on the historical performance of work item completion. Used to predict when future work will be completed using the work item count. Can lead to stable performance to allow for better forecasting.
Product Net Promoter Score
(NPS) is used to measure the response to the questions: Would you recommend this product to a colleague?
Gathers simple user feedback on if the product meets user needs and can be used to identify successful elements of product design and opportunities/ideas to increase user adoption.
User Analytics
Identifies usage patterns within the product. Determines the effectiveness of design; shows emergent usage patterns that warrant consideration for future investment. Great to augment business analysis and product design activities with actual user behavior. Google Analytics. AppSee.
Evidence-Based Management™ (EBM)
“Improving value delivery under conditions of uncertainty”
EBM focuses on improving outcomes, measuring value, reducing risks and optimizing investments. It is developed and sustained by Ken Schwaber and Scrum.org. Read more: EBM resources and the Evidence-Based Management Guide
Technical / Code Metrics for Agile Teams
Test Coverage
Monitors the percentage of codebase exercised by various types of automated tests. Guides efforts/investments to improve test coverage to sufficient levels. End goal: Examine trends & correlations between Defect Density and Test Coverage. See: Google, code coverage, Wikipedia
Build Time
Measures the execution time to run build and tests to provide dev team feedback. Useful to guard against slow builds & test execution that reduce the frequency of feedback.
Defect Density
Tracks percentage of defects in each area of the system – determined by functionality or code architecture. Helps identify parts of the app/code where quality can be improved. Data can help to identify unknown tech debt.
Code Churn
Measures the number of lines of code changed (added, deleted, modified) to complete a work item. Can be used to assess if the amount of code changed is reflective of the work item addressed. Promotes whole-team understanding of the code-base and alignment to agreed-upon design/code patterns and standards.
Code Ownership
Shows the frequency that team members change or commit to each area of the codebase. Used to illuminate, assess and promote collective code ownership. Reduces the bus factor, makes team members more t-shaped.
Code Complexity
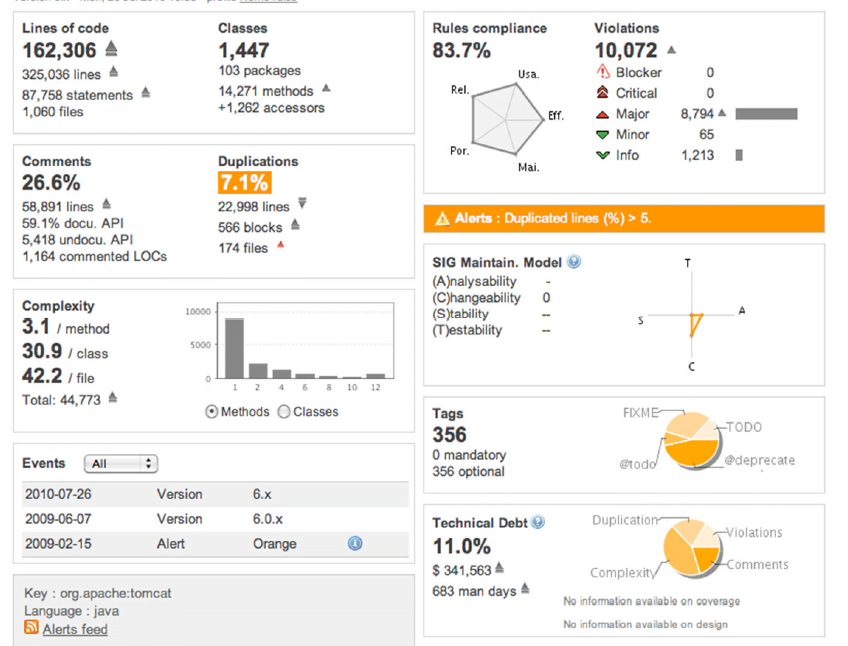 Cyclomatic complexity monitors a score of product codebase determined by a tool. Promotes engineering practices to create clean code using quantitative data. Enables the team to assess and understand the upward/downward trend of code complexity. For more, look at cyclomatic complexity.
Coding Standards Adherence
This is an assessment score of code alignment to architecture standards. Used to promote agreed upon coding standards to create clean code. Enables team learning to better align code to agreed-upon design patterns; identifies code that can be improved that may not be evident by code review.
Crash Rate
A log of incidents that cause an application/product to crash. Used to perform root cause analysis to reduce crashes. Allows the team to gain insights into product errors in released code that have significant impacts on the user experience.
Software Architecture
- Technical metrics: Performance, reliability, and security are technical metrics that can be used to measure the impact of a software architecture.
- Business outcomes: Revenue growth and customer satisfaction are business outcomes that can be used to measure the impact of a software architecture.
- Maintainability: Metrics like cyclomatic complexity can be used to measure how easy it is to understand, change, and extend code.
- Response time: Response time is a metric that can be used to ensure that the architecture meets precise timing constraints under different scenarios.
- Throughput: Throughput is a metric that measures the number of tasks that a service completes within a given time range.
- Structural Debt Index (SDI): SDI is a metric that can be used to capture architectural issues that may lead to more expensive future maintenance.
- Cyclic dependency index: This metric can be used to improve modifiability.
- Layer organization index: This metric can be used to improve layering.
- Module interaction index: This metric can be used to improve API usage.
- Module size uniformity index: This metric can be used to minimize the size of modules.

Read more:
People/Team: The Human Element
 When teams are measured only on their technical performance (Velocity, Running Tested Features, Earned Business Value, Throughput, Code Complexity, Test Coverage, take your pick) as if they were machines – with cogs to be oiled, tuned or replaced, we will cause some fairly nasty side-effects. Besides, all of those “technical” metrics tend to be lagging indicators of team performance and delivery. Wouldn’t it be better to react closer to real-time?
I firmly believe Team Joy is a leading indicator in team performance. A joyful team can overcome setbacks and adversity like nobody’s business. When things get tough, happy teams are more resilient, patient, and resourceful. They believe they can accomplish amazing things… and they usually do.
Many usable models have emerged for “measuring” the human element.
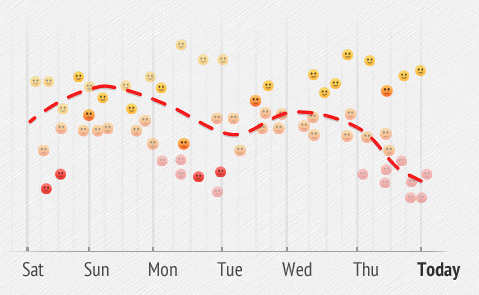
Happiness as an Agile Metric
Creates transparency regarding team member satisfaction. Enables the team to self-manage and improve morale.
 MoodApp – “MoodApp was designed and built by Atlassian to capture employee feedback. MoodApp allowed Atlassian employees to provide feedback to daily, and gave the company the opportunity to respond and adapt immediately if there was a problem brewing.”
- Niko Niko – [sad update – this app is no more…] “Powerful analytics enable your team to know how everyone is feeling creating an open, honest, positive environment for peak performance.” There are exactly three states: happy, neutral, sad. That’s it. No attempt at “precision” and no explanation, discussion, or interrogation.
- NEW: TeamMood.com – Based on the niko-niko practice, follow the mood at the team level with some very nice analytics
- Team Barometer – “The barometer is executed as a survey in a workshop. The survey consists of 16 team characteristics, packaged as a deck of cards. Team members vote green, yellow or red for each card in the meeting (or before the meeting as an anonymous survey). Once all cards have been run through, the team reflects and discusses the results.” Take 30-50 minutes.
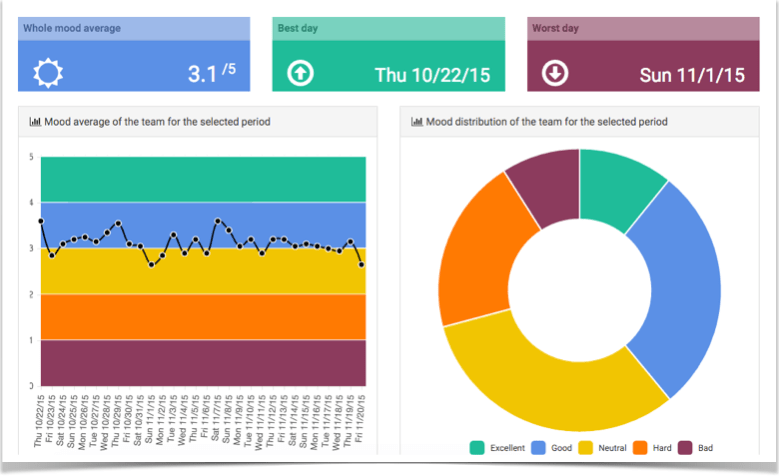
Overlay one of these plots on the team’s burn chart. Betcha see something interesting…
For more “human” options, see “Team Health Checks” as well as The Progress Principle.
Learning Log
A simple listing of items the team (or team members) have learned. Directs focus on the importance of learning. Promotes learning throughout a project; supportive of self-management and sustaining team morale and engagement. See also Snake on the Wall.
Team Tenure
Shows how long has each team member been on the team. Encourages activities reflective of tenure (mentoring for new team members, job/knowledge sharing for long-standing team members). Promotes whole team approach thinking as well as the potential to shift staff between teams with less risk.
Phone-A-Friend Stats
Tracks the number of times a former team member needs to be contacted for assistance. This agile team metric can be used to assess the effectiveness of job sharing, documentation, and knowledge transfer activities when team composition changes. Encourages a whole-team approach and shared work.
Whole Team Contribution
Percentage of team members that contribute to a work item throughout its lifecycle. Provides a quantitative metric to assess/improve the whole-team approach. Target goal: work items completed with at least the agreed-upon percentage of team members contributing to them.
Agile Fluency Model
Diana Larsen and James Shore co-founded the Agile Fluency Project with the goal that every team should work at the level of fluency that best fits their business’ needs. Fluency is a routine and deliberate practice that results in mastery that persists under stress. The Agile Fluency Diagnostic provides a guided self-assessment that helps teams determine their position on the Agile Fluency pathway and with the support of trained facilitators, they can chart a course towards continuous improvement. Learn more about the methodology via this video.
Takeaways – Agile Metrics
Getting Started
With so many wonderful metrics to choose from, how is a team to choose? Scan the lists above, and see if the team can answer:
- Why “this metric?” – Why does it matter?
- What insights might we gain from it?
- What is expected to change?
- How might it be gamed, misused (or abused)?
- How often would we like to “take a data point”
- How long will we run the experiment? (Reco min 2 iterations….)
- How will we know when we’re “done” with this metric (and it’s served its purpose, and it’s time to retire it and consider another..)
- How will we make our measurements transparent – to promote knowledge sharing, collaboration with other teams and trust with our sponsors?
Remember:
- That which is measured will improve, at a cost. Which metrics are used should be arrived at by team consensus – not mandated by management.
- When a measure becomes a target it ceases to be a good measure. Look for and understand trends. Not hitting magic numbers.
- Correlation is not causation, but it sure is a hint. Use metrics as a diagnostic tool.
- Go for reliability and consistency…
And most importantly, expose how the team feels in near real-time – so they can identify what’s going on and what’s likely to happen soon.
Making Agile Metrics Transparent
Metrics are for agile and scrum teams to learn and explore how they can improve themselves through inspect and adapt cycles. And agile team metrics can scale to teams of teams, i.e., the larger organization where all teams “own the metrics” for their parts of the pie.
Yes, sharing your teams’ metrics with stakeholders can be a bit scary if you’ve ever been in a place where metrics have been used as a weapon, but take a leap. As Appelo says in M4H: “Be transparent… Show them to others and ask the same courtesy from them. Discuss it all together…”
Collectively look through just enough lenses to build an integrated and holistic view.
And then collaborate on improving all the things.
Read / Explore More
- Inspired by a presentation given by @DocOnDev, Michael “Doc” Norton, the Director of Engineering at Groupon
- Added in info from Jason Tice www.theagilefactor.com
- As well as from Growing Agile
- NCD Conference Video
- Agile Mythbusters – Metrics & Insights | RallyON 2013
- Happiness Metric – The Wave of the Future
- Measuring Team Performance, Ken Rubin
- Beware: You Get What You Measure!
- ScrumSense Agile Metrics
- Tips from nesma on what NOT to measure…
- How Metrics Can Be Used and Abused by Management
- Building Continuous Improvement: Metrics Ecosystem with LEGO
- Kathryn Kuhn – Unlock Excellence with Agile Metrics
- 3 Simple Productivity Metrics for Agile or Waterfall
- An Appropriate Use of Metrics – Martin Fowler
Books on Agile Metrics
- Managing for Happiness: Games, Tools, and Practices to Motivate Any Team
- Agile Metrics in Action: How to Measure and Improve Team Performance
- Making Work Visible: Exposing Time Theft to Optimize Work & Flow
- The DevOps Handbook: How to Create World-Class Agility, Reliability, and Security in Technology Organizations
- Actionable Agile Metrics for Predictability
- Start with Why
- Cynefin – Weaving Sense-Making into the Fabric of Our World
- Create Your Successful Agile Project: Collaborate, Measure, Estimate, Deliver
- The Visual Display of Quantitative Information
- Agile Culture, The: Leading through Trust and Ownership
“By striving for consistency and stability (i.e., predictability) they will find that increased performance (velocity included) will come as a natural side effect.” I totally agree with that quote. Additionally, I feel that there are other intangible benefits that come from predictability, including the ability to make better short term product backlog/planning decisions since there is confidence in the team’s ability to consistently hit their target on the mark.